The confusion matrix and threshold-variant metrics
Many of the most helpful and intuitive metrics of learner/model performance depend on converting predicted probabilities into predicted binary classifications (or ‘0’ or ‘1’ predictions of the outcome). To do this, we first need to specify a threshold. After selecting a threshold, predicted probabilities above the threshold indicate that the predicted outcome equals ‘1’ (or ‘yes’), and predicted probabilities below the threshold indicate that the predicted outcome equals ‘0’ (or ‘no’). For example, we may specify a threshold of 0.5. Then, turning back to our example on the previous page, any student with a predicted probability greater than or equal to 0.5 is considered “predicted to drop-out,” while any student with a predicted probability less than 0.5 is considered “not predicted to drop-out.”
Later, we will discuss how to pick a threshold. For now, once we have picked a threshold, we can then compare each resulting predicted classification (i.e. predicted outcome) to the actual, true, observed classification (e.g. whether or not a student actually dropped out.) Sometimes We can summarize the comparisons in 2x2 matrix called a confusion matrix:
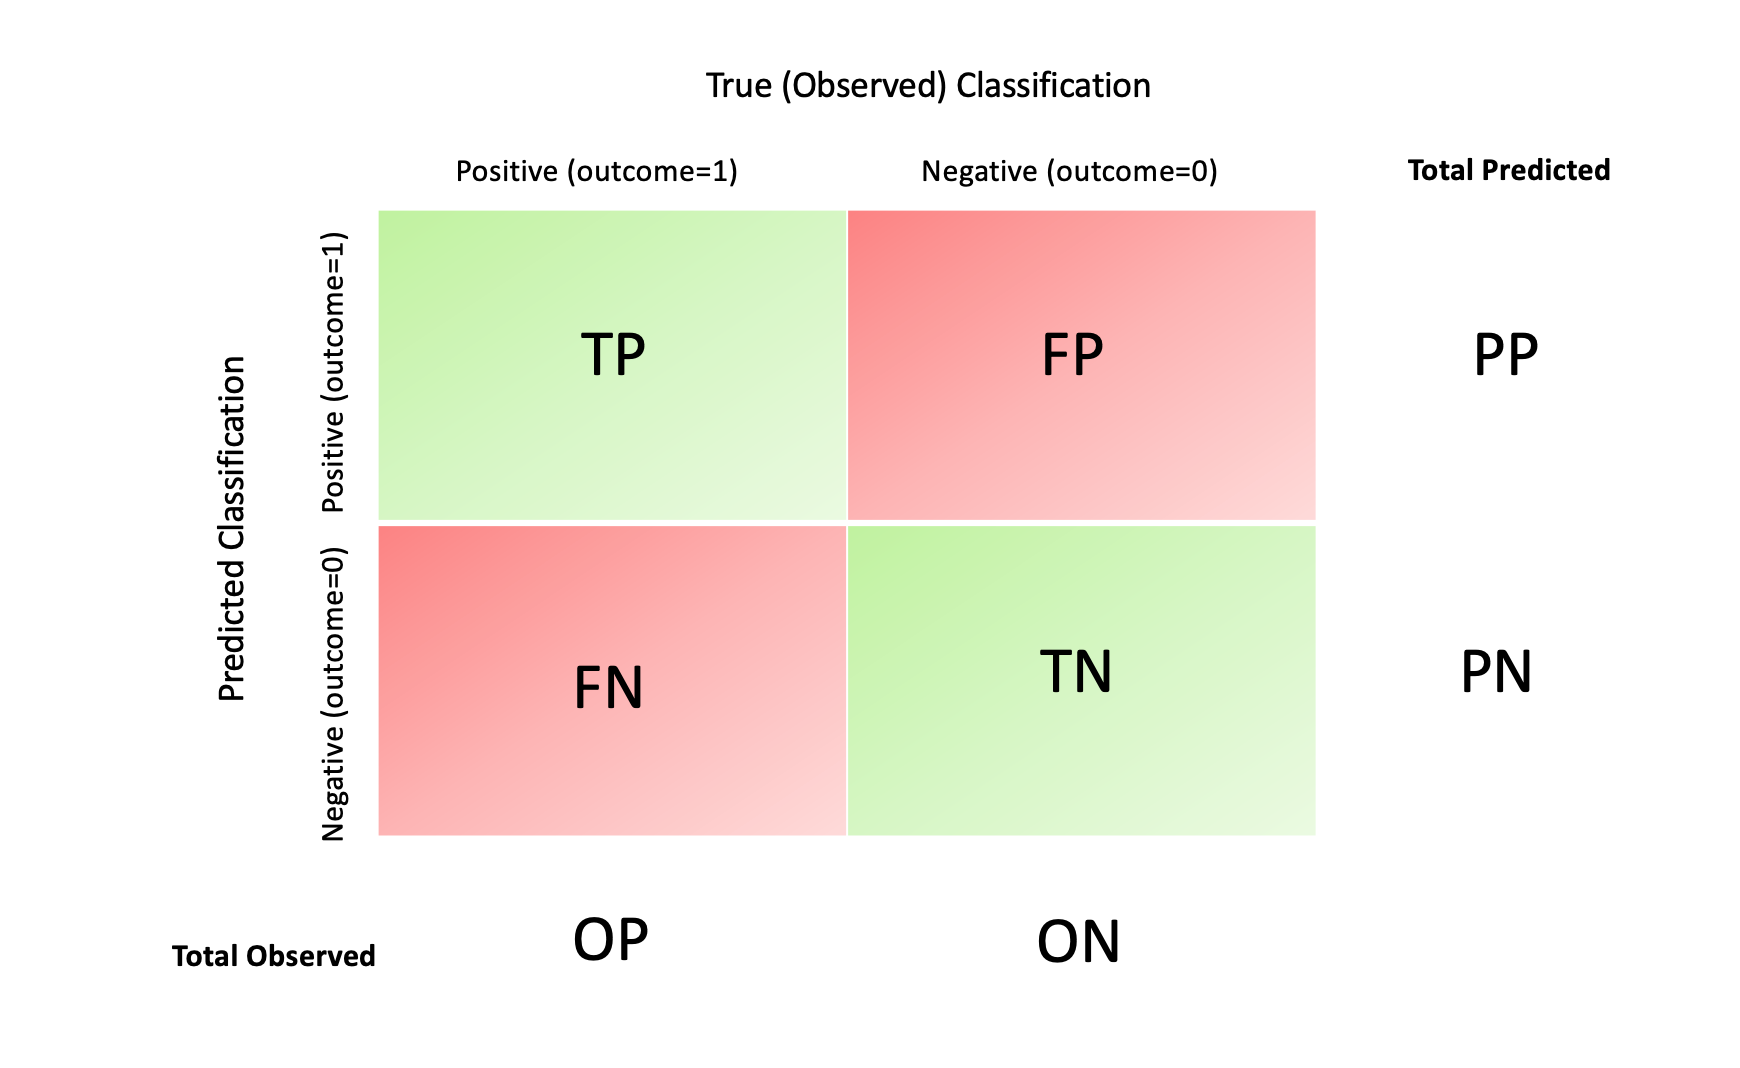
Within a confusion matrix, observations are categorized into one of the following cells:
True positives (TP): the predicted classification (or “class”) is ‘1’ (‘yes’) and the true classification is ‘1’.
False positives (FP): the predicted classification (or “class”) is ‘1’ (‘yes’) but the true classification is ‘0’.
False negatives (FN): the predicted classification (or “class”) is ‘0’ (‘no’) but the true classification is ‘1’.
True negatives (TN): the predicted classification (or “class”) is ‘0’ (‘no’) and the true classification is ‘0’.
Note that for “true positives” and “false positives”, the predicted and observed classification match, while in “false positives” and “false negatives” we make a prediction that does not match the true classification.
We also calculate the following totals:
Observed positives (OP): the number of observed (true) positives (the number of observations for which the outcome is observed to be ‘1’).
Observed negatives (ON): the number of observed (true) negatives (the number of observations for which the outcome is observed to be ‘0’).
Predicted positives (PP): the number of predicted positives (the number of observations for which the outcome is predicted to be ‘1’).
Predicted negatives (PN): the number of predicted negatives (the number of observations for which the outcome is predicted to be ‘0’).
Finally, we can also summarize these categories into many different rates. Below is a list of various rates that may be helpful. In a later page, we will discuss how to pick different metrics to align with goals for the project.
Rates based on total true, observed number of one classification (OP or ON):
- True positive rate (TPR): the proportion of observed positives that were correctly predicted as positive. The TPR is also known as sensitivity or recall.
- True negative rate (TNR): the proportion of observed negatives that were correctly predicted as negative. The TNR is also known as specificity.
- False positive rate (FPR): the proportion of observed negatives that were incorrectly predicted as positive. Note that specificity is equal to 1-FPR.
- False negative rate (FNR): the proportion of observed positives that were incorrectly predicted as negative.
Rates based on total predicted number of one classification (PP or PN):
- Positive predictive value: the proportion of predicted positives that were true observed positives. The PPV is also known as precision.
- Negative predictive value:: the proportion of predicted negatives that were true observed negatives.
- False discovery rate: is proportion of predicted positives that are false positives. The FDR is equal to 1-precision.
Rate based on total sample size (total number of predictions):
- Accuracy: is proportion of all observations (units) that were correctly classified.
A note on accuracy: Accuracy is highly sensitive to the true probability of success. Imagine a scenario where 95% of people are truly successful. You create an algorithm or model that predicts every single person will succeed. Your model will be 95% accurate! Thus, you should be careful when using accuracy as a performance metric.
Back to top