Training and validating learners
Once we have stored away our test data, we need to figure out how to use the rest of our data for training and validation. There are multiple approaches. Here we will go over how the training and validation are implemented in the PA Tool Set templates you will use, but I will comment on some alternative variations.
Recall that it is imperative to train (i.e. fit a model or build a machine learning algorithm) in one dataset and to validate (assess performance and fairness) in a different dataset. This buffers against overfitting.
We can set aside a portion of the non-test data and designate that portion for validation. We can then use the remaining data for training. For example, we can set aside 20% of the remaining data for validation, and use the remaining 80% for training. That is, we fit all the learners with 80% of our data and compare predictions to the truth in 20% of the data, allowing us to compute various metrics of performance and fairness. This is common and valid practice.
We can also repeat this process more than once. That is, we can let different portions of the data take turns for training and for validation. This procedure is referred to \(v\)-fold cross-validation, in which \(v\) is the number of folders or partitions - or times we repeating the training and validation. The following diagram illustrates 5-fold cross-validation:
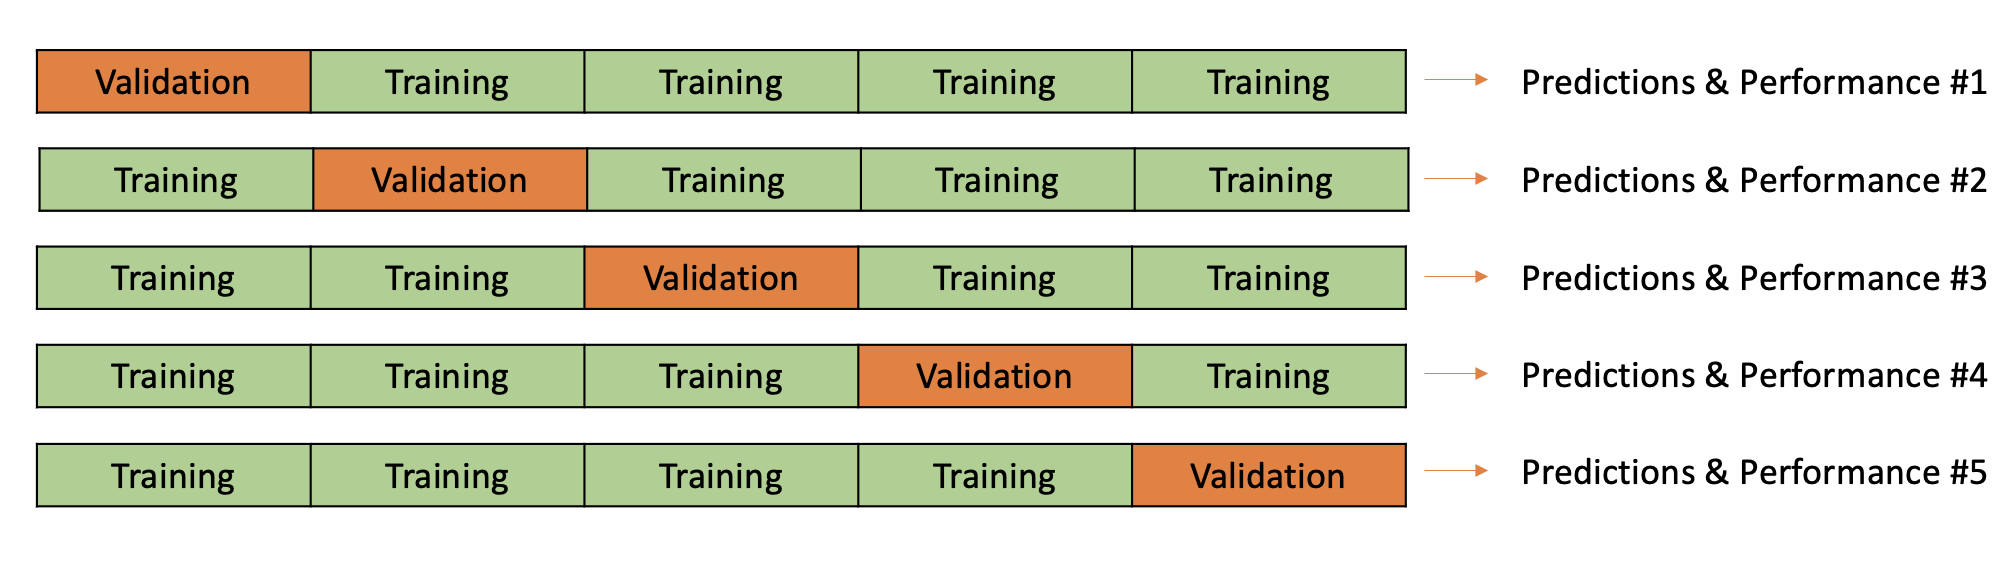
This diagram is showing that the data are split into 5 folds. Each fold takes a turn as a validation fold, while all the other folds are combined for learner training. When a fold takes a turn as a validation fold, we obtain predicted likelihoods for each observation in that fold. We can then compute metrics of learner performance and fairness for each fold. We can average the metrics across the 5 folds. Alternatively, we can use the predicted likelihoods that result across all the folds to compute metrics. Our PA Tool Set does a combination of both. For a few metrics, it returns averages from across the folds. For remaining metrics, it relies on the predicted likelihoods. This will be reviewed when we turn to the code. (And don’t worry - the PA Tool Set implements \(v\)-fold cross-validation for the user. You will not need to code the procedure; you will just specify how to the cross-validation should be implemented, following the guidance below.)
Guidance for implementing \(v\)-fold cross-validation:
Number of folds: A recommended default for \(v\) is 5. Higher values of \(v\) (more folds) may be preferable if there is a large amount of data because the average performance across the folds will be more representative of the true performance (less biased), albeit with more variability in the estimates (larger variance). Additionally, more folds result in increased computation time, which can be significant. Alternatively (although also more computationally demanding), the entire \(v\)-fold cross-validation procedure can be repeated multiple times. In other words, we can obtain results from 5 folds, then resample to create 5 different folds and consequently acquire another set of results from another 5 folds of the same size. This approach may be advantageous if the sample size is small, as there could be substantial variability in the metrics across folds. (However, our current tool set code templates do not support this functionality.)
How to specify folds: Typically, the folds are randomly partitioned. However, it may be desirable to specify the folds to align with analytic goals. For example, a key limitation of \(v\)-fold cross-validation with random partitioning is that each fold consists of observations from different points in time. That is, if the data we are using for training and validation consists of 5 years of data, random partitioning would mean data from across all five years are used in training and in validation. Since our goal is to generalize a model over time, we might want to have each year of data serve as a validation fold.
Stratification: In some circumstances, we recommend stratifying the cross-validation. For example, if a positive or negative value of a binary outcome is rare (e.g. it is “yes” or “1” for less than 30 percent of the sample), then some folds could have an unlucky random draw with very few “yes” or “1” outcomes. To protect against this, we can stratify the cross-validation. This means we can (1st) randomly partition those observations for which the outcome = 1; and then (2nd) separately randomly partition those observations for which the outcome = 0; then (3rd) pair each partition with outcome =1 with a partition with outcome = 0 to get \(v\) folds with equal proportions of each value of the outcome. Note that the PA Tool Set templates will ask if you want to stratify by a measure. If you enter a variable name, the stratified cross-validation will be automatically done for you.
Tuning with \(v\)-fold cross-validation:
The PA Tool Set will automatically optimize tuning parameters. It does this with \(v\)-fold cross-validation. The code will automatically compare learner validation across a grid of different combinations of tuning parameters.
The comparisons will focus on just one of two metrics selected by the user - either the area under the curve of the receiver-operator curve (AUC ROC) or the area under the curve of the precision-recall curve (AUC PR). We will learn about these two measures later. The point to take away here is that the combination of tuning parameters that results in the highest AUC ROC or AUC PR, averaged across the \(v\) folds, will be selected as the “tuned learner.” The user will then only view results of the tuned learner going forward.
Note that using the same cross-validation procedure for both parameter tuning and learner validation and comparison is not technically, completely correct. Using the same data twice for both goals is sometimes called “double-dipping.” That is, using the same data again to validate the performance of the tuned learner, we may get overly optimistic performance estimates (overfitting) because the models have already “seen” that data during the tuning process. To correct for this, there are two approaches: (1) As described above, we can set aside a subset of data for validation. In this case, we first conduct parameter tuning using \(v\)-fold cross-validation with the training data, but then compare the tuned learners’ performance in the held-out validation data. Alternatively, (2) we can use a nested \(v\)-fold cross-validation. In nested cross-validation, we have an outer loop of cross-validation for model validation, and an inner loop of cross-validation for parameter tuning. This allows you to use the same data for both tuning and validation, but in a way that prevents biased performance estimates. This approach may be preferable when there are not sufficient data to hold out a separate validation data set. Sorry, our tool set templates do not have these options at this time.
But although our performance in the validation may be inflated, it should be inflated for all learners, still allowing us to make valid comparisons and to select the “best” learner. Remember, it is the testing that provides the best assessment of how well our models actually perform in new, unseen data.