What are the most important predictors in my model?
Understanding which predictors matter most in your model serves two closely related purposes:
- Understanding your model: Which features is the model relying on most heavily? Does this align with what domain experts would expect?
- Communicating results: Stakeholders will often want to know why the model flags certain individuals as high-risk. Variable importance (VI) provides a way to answer that question.
VI results can also serve as a model check. If the most important predictor turns out to be something unexpected — or something you know to be a flawed measure — that is worth investigating before deployment.
The value of variable importance
The following chart illustrates how VI relates to — but differs from — predictive analytics more broadly:
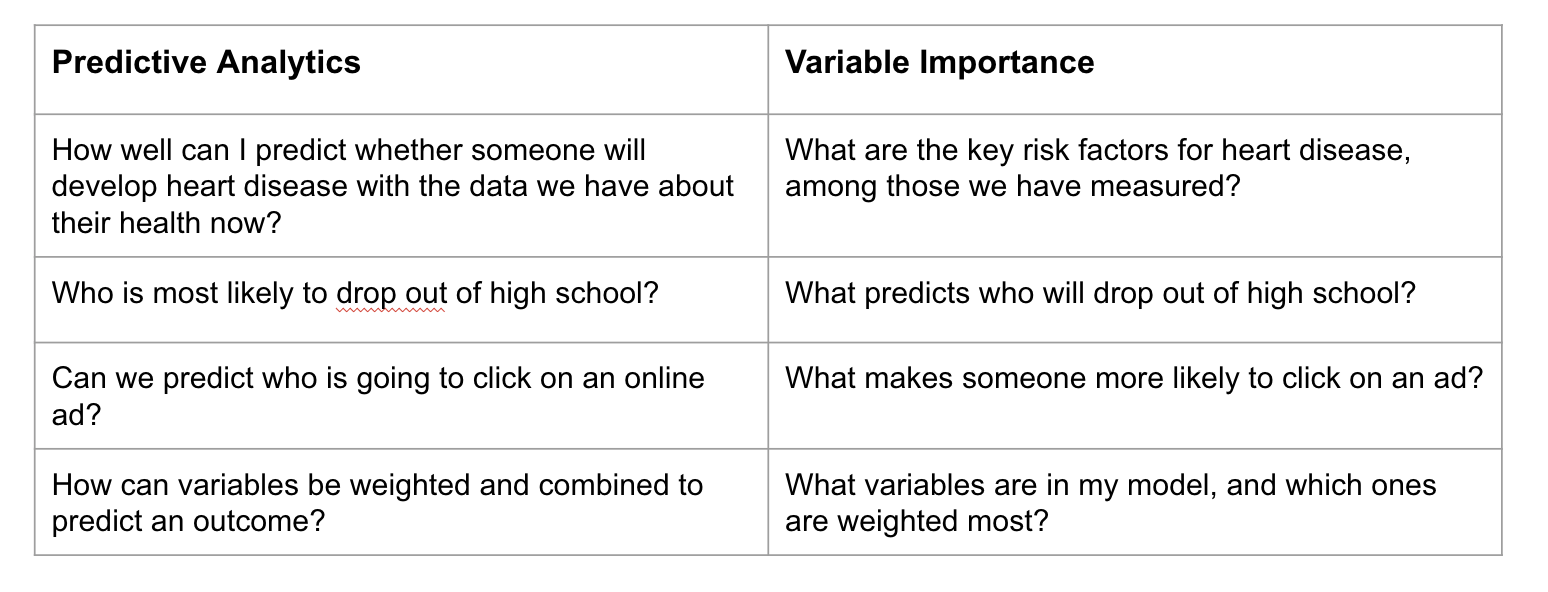
Predictive analytics asks: How well can we predict who will experience the outcome? Variable importance asks: Which features does the model use most heavily to generate those predictions? These are related but distinct questions. Importantly, VI does not tell you what causes the outcome — only what the model has learned to use as signals in your data.
Variable importance methods
There are many methods for estimating VI. Two distinctions are worth understanding before choosing an approach.
Model-specific vs. model-agnostic
- Model-specific methods are built into a particular modeling approach and can only be applied to that model type.
- Model-agnostic methods can be applied to any model, making them more flexible — especially useful when comparing multiple learners.
Global vs. local
- Global VI methods summarize which predictors matter most across all predictions — useful for explaining the overall model to an audience.
- Local VI methods explain a single individual’s prediction — useful when a caseworker or program staff member wants to understand why a specific person was flagged as high-risk.
Model-specific methods
Each modeling approach has its own native VI measure. A few examples:
- Logistic regression: VI is typically assessed based on the size and statistical significance of coefficients. Larger absolute coefficients indicate stronger associations with the outcome, though direct comparisons across variables on different scales can be misleading, and multicollinearity can complicate interpretation.
- Tree-based models (decision trees, random forests, XGBoost): VI is often measured by how much each feature reduces impurity (e.g., Gini importance) across splits. These methods can spread importance across many correlated features, so results should be interpreted with care.
Model-specific methods are convenient but have limitations: they may not translate well across model types, and their behavior with correlated predictors varies.
Model-agnostic methods
Permutation importance
Permutation-based VI measures how much model performance drops when a single feature’s values are randomly shuffled — breaking its relationship with the outcome. A large drop signals that the feature is important; a small drop suggests the model performs nearly as well without it. This method works with any modeling approach and can be applied to individual variables or groups of related variables.
SHAP (SHapley Additive exPlanations)
SHAP asks: How much does each feature contribute to moving a specific prediction away from the model’s average prediction?
SHAP can be used in two ways:
- Globally: Averaging SHAP values across all predictions to summarize which features drive the model overall.
- Locally: Examining SHAP values for a single individual to explain why they received a particular predicted probability.
The global view might show that absenteeism is the strongest overall driver of predictions. The local view might reveal that for one specific student, a low reading score was the primary factor, even if absenteeism matters more across the population. This local interpretability is especially valuable in public services contexts, where staff may need to understand and explain decisions affecting specific individuals.
SHAP accounts for interactions and dependencies among features, which often makes it more accurate than simpler approaches — though also more computationally intensive.
Choosing a VI method
No single VI method is best in all situations. The table below offers practical guidance:
| Situation | Suggested approach |
|---|---|
| Quick overview during model development | Model-specific VI |
| Comparing VI across multiple learners | Permutation importance |
| Explaining the overall model to stakeholders | SHAP (global) |
| Explaining an individual prediction to program staff | SHAP (local) |
Communicating VI results
When sharing VI results with stakeholders, a few principles help:
- Lead with the “so what.” Don’t just present a ranked list of features — explain what the top predictors reveal about who the model is flagging and why.
- Reinforce the causation caution. VI shows what the model is using as signals, not what causes the outcome. Make this explicit so stakeholders do not misinterpret these results as reasons to target specific characteristics directly.
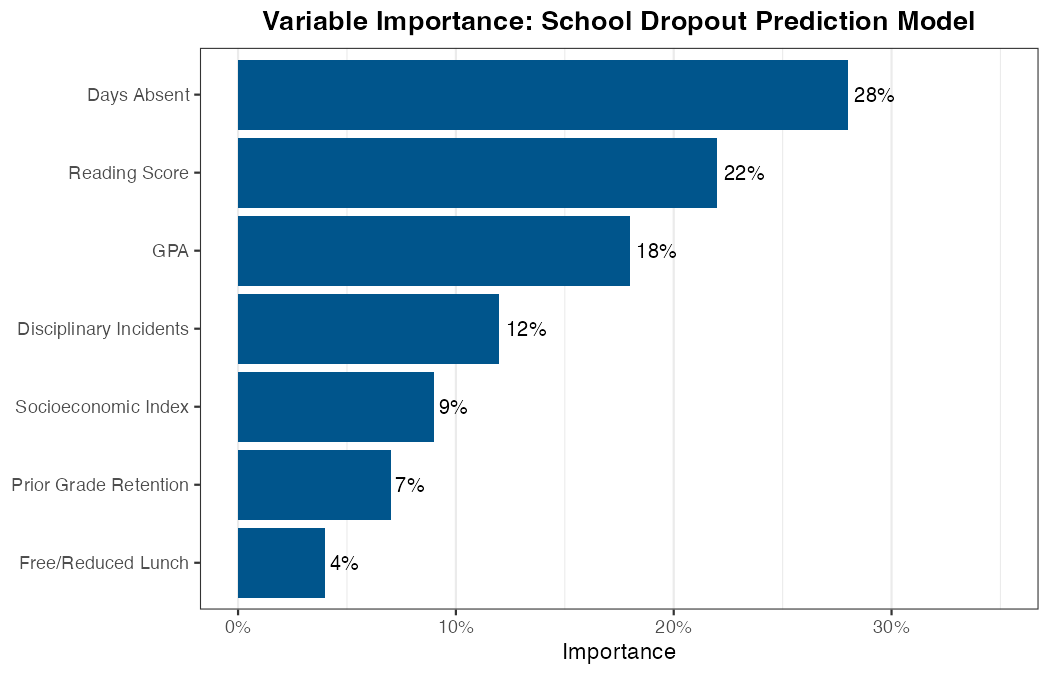
- Visualize clearly. A horizontal bar chart ranking features by importance is typically the most readable format for non-technical audiences.
The plot below shows an example of what VI results might look like for the school dropout model:
Finally, as optional further reading, this paper demonstrates how PA and VI can be combined and translated into actionable insights for refining program services:
https://www.acf.hhs.gov/sites/default/files/documents/opre/Predicting-HMRF-Participation-Brief.pdf